Updated: 24 Mar 2026
Source
import numpy as np
import matplotlib.pyplot as plt
import ipywidgets as widgets
from ipywidgets import interact
from matplotlib.gridspec import GridSpec

np.random.seed(42)

# Data
x = np.linspace(0, 20, 7)
y = 2.03 * x + np.random.normal(0, 3, len(x))

# range for a
a_min, a_max, steps = 0, 3, 50
a_vals = np.linspace(a_min, a_max, 50)

# make chi-squared curve
chi2_vals = np.array([np.sum((y - a * x)**2) for a in a_vals])
a_opt = a_vals[np.argmin(chi2_vals)]
saved = False # for saving the figure only once

def update(a):
    # Model and residual
    y_model = a * x
    residuen = y - y_model
    chi2 = np.sum(residuen**2)

    fig = plt.figure(figsize=(11, 6))
    gs = GridSpec(2, 2, width_ratios=[2, 1.4], height_ratios=[3, 1], figure=fig)

    ax_main = fig.add_subplot(gs[0, 0])
    ax_res = fig.add_subplot(gs[1, 0], sharex=ax_main)
    ax_chi2 = fig.add_subplot(gs[:, 1])

    # --- upperleft plot: data + model ---
    ax_main.plot(x, y, 'k.', markersize=10, label='Data')
    ax_main.plot(x, y_model, 'r--', linewidth=2, label=fr'Model: $y = {a:.2f}x$')
    ax_main.set_ylabel('y')
    ax_main.set_title('Data and model')
    ax_main.legend()
    ax_main.grid(alpha=0.3)

    # --- bottom left plot: residuals ---
    ax_res.axhline(0, color='gray', linestyle=':', linewidth=1)
    ax_res.plot(x, residuen, 'bo', markersize=7)
    ax_res.vlines(x, 0, residuen, color='b', alpha=0.6)
    ax_res.set_xlabel('x')
    ax_res.set_ylabel('residuals')
    ax_res.set_title('Residuals')
    ax_res.grid(alpha=0.3)

    # --- right plot: chi-squared-curve ---
    ax_chi2.plot(a_vals, chi2_vals, 'k-', linewidth=2)
    ax_chi2.plot(a, chi2, 'ro', markersize=9, label=fr'$\chi^2 = {chi2:.2f}$')
    ax_chi2.axvline(a, color='r', linestyle='--', alpha=0.5)
    ax_chi2.set_xlabel('coefficient a')
    ax_chi2.set_ylabel(r'$\chi^2 = \sum (y - ax)^2$')
    ax_chi2.set_title(r'$\chi^2$ as a function of a')
    ax_chi2.legend()
    ax_chi2.grid(alpha=0.3)

    plt.tight_layout()

    global saved
    if abs(a - a_opt) < (a_max-a_min)/steps and not saved:
        # fig.savefig("figures/chi2_fit.eps")
        # fig.savefig("figures/chi2_fit.png", dpi=450)
        saved = True
    plt.show()

interact(
    update,
    a=widgets.FloatSlider(min=a_min, max=a_max, step=(a_max - a_min) / steps, value=1, description='a')
)
Output
---------------------------------------------------------------------------
ModuleNotFoundError                       Traceback (most recent call last)
Cell In[1], line 3
      1 import numpy as np
      2 import matplotlib.pyplot as plt
----> 3 import ipywidgets as widgets
      4 from ipywidgets import interact
      5 from matplotlib.gridspec import GridSpec

ModuleNotFoundError: No module named 'ipywidgets'Figure 1 shows the results of fitting our linear model to the data. Parameter is optimal when the chi-squared curve is at its minimum, which corresponds to the smallest residuals and the best match between model and data.
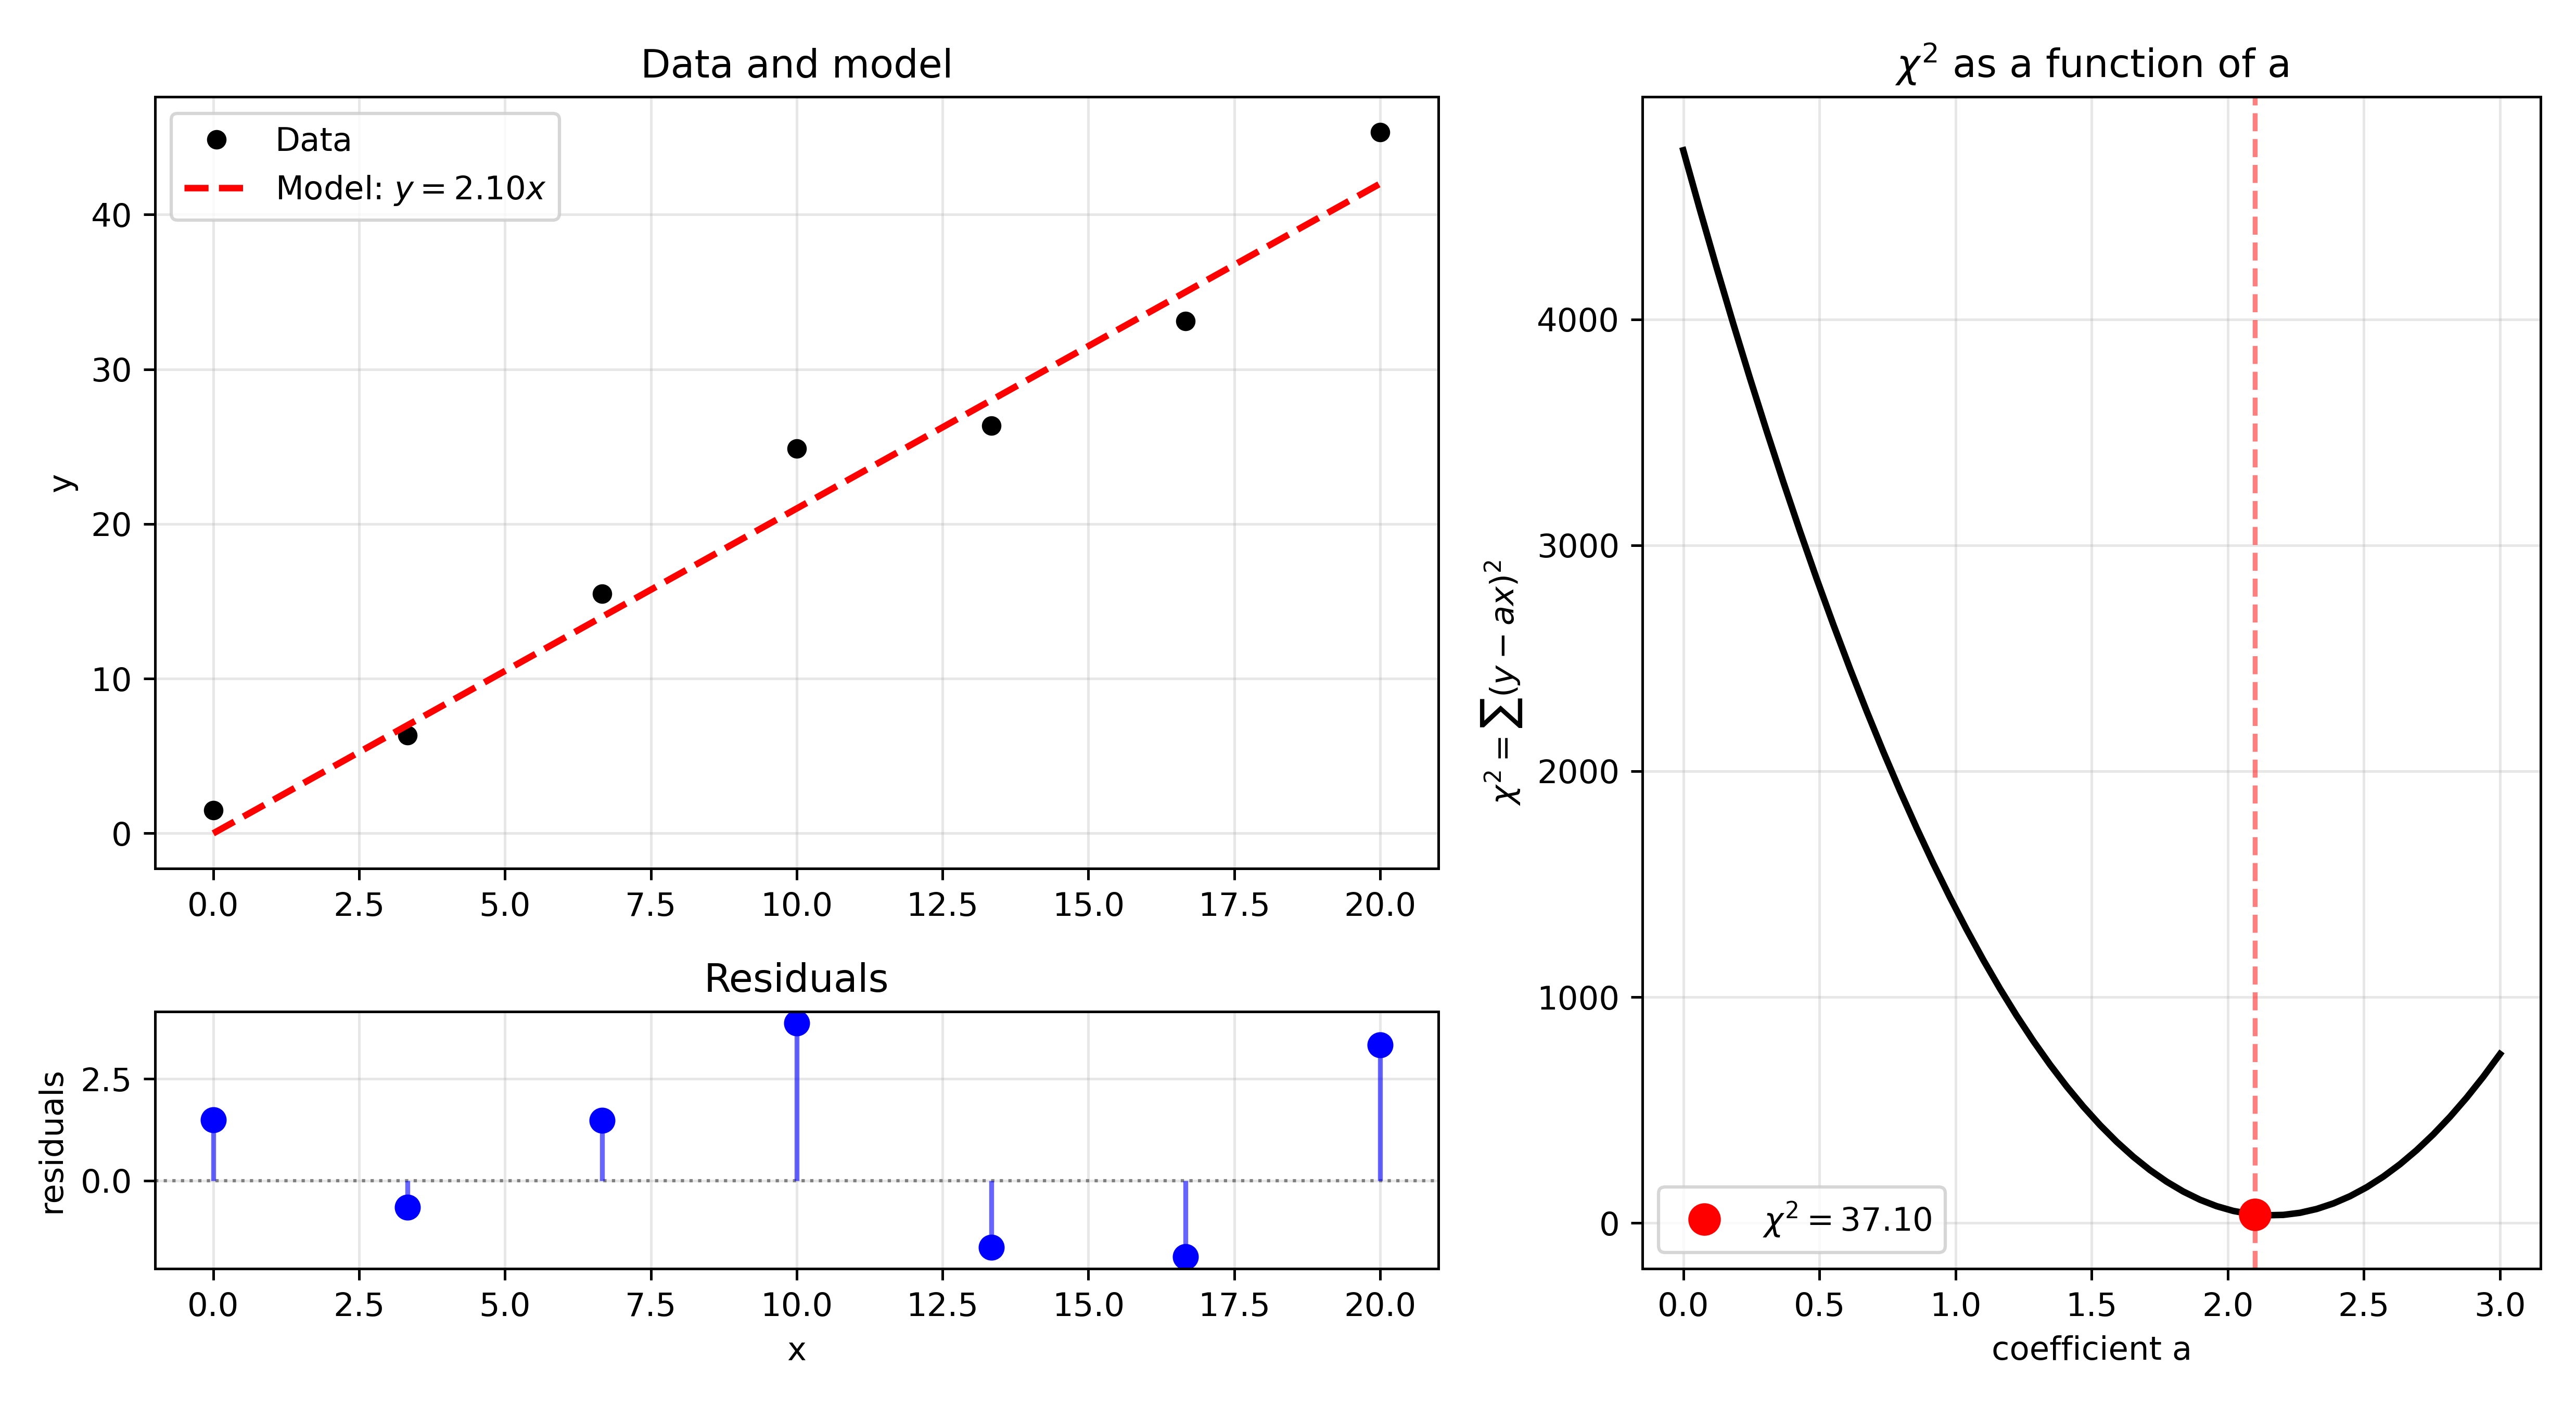
Figure 1:Fitting our data to a linear model with a single parameter . The optimal value of is found when the chi-squared curve (bottom) is at its minimum. The residuals (top right) are smallest at this point, and the model (top left) best matches the data.